Confidentiality Agreement
To access the Sponsor’s private offering documents for this investment, you must first acknowledge and agree to the below.
By clicking the ‘I Agree’ button below:
Multifamily
South Hill Apartments
San Antonio, TX
Funded
100% funded
...
South Hill Apartments
San Antonio, TX
All Investments > South Hill Apartments
...
Overview
South Hill Apartments
South Hill is located in a market that the Sponsor knows well and the Sponsor believes the Property is an appropriately valued asset that will be positively leveraged at acquisition with several value-add components.
current
current
current
current
current
current
current
current
current
current
current
current
current
Videos
Details
For more information, view the Sponsor's Investment Memorandum.
Estimated First Distribution 7/2024
Minimum Investment 35000
Estimated Hold Period 3 Years
Investment Strategy Value-Add
Investment Type Equity
# Units 174
Current Occupancy 93%
Year Built 1965
Total CapEx Budget $1,347,000
Exit Cap Rate 5.75%
Sponsor Documents
The offering documents above have been prepared and are being delivered by the Sponsor of this investment opportunity, and not by RM Securities, LLC. RM Securities, LLC and its associated persons did not assist in preparing, do not explicitly or implicitly adopt or endorse, and are not otherwise responsible for, the Sponsors offering documents posted below or any content therein.
Deal Highlights
Investment Highlights
South Hill was initially marketed with a price expectation of $15 million in late 2022, a valuation that represented nearly double what the seller bought the asset for in 2019. Since that initial effort, however, the asset has been in and out of contract twice, and the seller moved brokerages. In both instances, the potential buyers noted that they misjudged the available financing, which greatly frustrated the seller.
This year, investors have rightly shown a greater appetite for real estate opportunities when projects provide for an adequate risk-adjusted return compared to more liquid investments. These real estate projects are currently difficult to find, but CSC believes that the projected first-year unlevered return on investment at South Hill (same as the acquisition's cap rate) at 7.00% provides an appropriate spread over the market returns that could be expected in short term treasury bills and bonds, CDs, or high yield savings accounts.
Cooper Street Capital ("CSC") is a Repeat Sponsor on the RealtyMogul technology platform with a proven track record on the platform and in the San Antonio market. The firm previously completed two other projects using the RealtyMogul technology platform, including Barberry Village Apartments in Portland, OR, which sold for a project level 36.6% IRR, and the Amber Hill Apartments in San Antonio, which sold for a project level 63.3% IRR. The South Hill Apartments will be the firm's sixth acquisition in the San Antonio market, bringing the firm's current portfolio to 415 units in the market and its total track record in the market to 915 units.
The South Hill acquisition will be structured with a seven-year fixed loan from Fannie Mae with a target hold period of three years. The Project's returns have factored in the yield maintenance costs of paying off the loan within this projected three-year horizon, in advance of the loan's maturity. As a result, CSC and its partners will have the ability to exit in a shorter-term horizon, if the economics are optimal, or to hold the asset for a longer period if the returns remain accretive.
Cooper Street Capital is a fully vertically integrated private equity real estate firm. The life cycle of each asset is managed in-house from acquisition to operations to sale, thereby ensuring that each asset is running at full efficiency. The day-to-day operations of each asset are carried out by the staff of CSC Management, a subsidiary property management company wholly owned by Cooper Street Capital, with close oversight. On the day of closing at South Hill, the team at CSC Management will be on-site ready to kick the asset into gear.
Contact Us
Questions before investing?
Speak with our Investor Relations team.
Schedule a Call
Management
For more information, view the Sponsor's Investment Memorandum.
Cooper Street Capital

Cooper Street Capital (“CSC”) provides investment access to the commercial real estate space for retail, family office, and institutional investors. As a private equity real estate firm, CSC applies targeted acquisition strategies and active asset management to provide consistent risk-adjusted returns for investors in value-add and core-plus multifamily real estate opportunities. CSC aims to capture upside potential for its partners through both physical renovations and/or major operational improvements.

Since the firm's founding in 2011, CSC’s team has stayed committed to sourcing commercial real estate investment opportunities from across the United States that have demonstrated strong financial performance in the past or that exhibit the potential for gains in the future. In either case, potential acquisitions must be supported by strong market fundamentals.

CSC aims to minimize downside risk for its partners through “deal-by-deal” and targeted acquisitions. The firm seeks out existing multifamily real estate assets that can provide for continued cash flow and where value can be built upon through the process of driving up an asset’s yearly Net Operating Income (NOI). The firm is headquartered in Aspen, Colorado. 

Sponsor Track Record
Property Name City, State Asset Type Status Acq Date Units Purchase Price Sales Price or Estimated Value IRR EMx
Highland Park Albuquerque, NM Multifamily SOLD 2/1/2013 80 $5,125,000 $6,400,000 18.40% N/A
Maroon Peak Netherwood  Albuquerque, NM Multifamily SOLD 8/1/2013 220 $13,975,000 $18,500,000 12.90% N/A
Citadel Apartments Albuquerque, NM Multifamily SOLD 3/1/2014 233 $9,719,000 $14,792,000 33.40% N/A
I-95 Portfolio Portland, ME Multifamily SOLD 7/1/2014 54 $6,550,000 $9,500,000 18.00% N/A
Bowdoin Realty Portfolio Portland, ME Multifamily SOLD 12/1/2014 41 $5,630,000 $9,900,000 22.30% N/A
94-96 Winter Portland, ME Multifamily SOLD 2/1/2015 10 $900,000 $1,400,000 54.50% N/A
Bricklight Capital Portfolio Portland, ME Multifamily SOLD 7/1/2015 45 $4,900,000 $7,100,000 20.50% N/A
East End Apartments Portland, ME Multifamily SOLD 9/1/2015 37 $4,300,000 $5,800,000 24.10% N/A
Bricklight II  Portland, ME Multifamily SOLD 9/1/2015 24 $2,730,000 $3,250,000 25.20% N/A
773 Congress  Portland, ME Multifamily SOLD 9/1/2015 5 $390,000 $420,000 29.60% N/A
59 Bramhall  Portland, ME Multifamily SOLD 10/1/2015 9 $625,000 $750,000 48.00% N/A
Bear Creek Apartments  Albuquerque, NM Multifamily SOLD 6/1/2016 84 $2,820,000 $3,400,000 30.50% N/A
Cedar 31 Apartments  Austin, TX Multifamily OWNED 4/9/2017 14 $2,310,000 $3,100,000 N/A N/A
Bannister Apartments  Austin, TX Multifamily SOLD 5/1/2017 34 $2,485,000 $3,300,000 18.30% N/A
1515 Clermont  Denver, CO Multifamily SOLD 7/1/2017 36 $5,500,000 $7,150,000 14.00% N/A
The Goose Nest Apartments Portland, OR Multifamily SOLD 8/1/2017 22 $3,075,000 $4,260,000 20.10% N/A
Villas de la Luz  Austin, TX Multifamily SOLD 1/1/2018 240 $20,500,000 $25,225,000 22.80% N/A
Courtyard and Arbors Apartments Albuquerque, NM Multifamily SOLD 2/1/2018 529 $31,100,000 $38,000,000 18.30% N/A
English Aire and Lafayette Landing Austin, TX Multifamily SOLD 8/1/2018 397 $38,750,000 $45,000,000 50.70% N/A
Sage Canyon  Albuquerque, NM Multifamily SOLD 8/24/2018 105 $8,790,000 $10,260,000 38.15% 1.54x
CSC North Austin Portfolio  Austin, TX Multifamily SOLD 1/1/2019 523 $56,000,000 $62,350,000 50.70% N/A
Gallery Park and Westfal  Portland, OR Multifamily OWNED 1/18/2019 93 $18,200,000 $2,600,000 N/A N/A
Mueller Rose Austin, TX Multifamily SOLD 3/15/2019 181 $18,825,000 $30,000,000 25.10% 1.93x
CSC Spanish Trails Austin, TX Multifamily SOLD 3/1/2019 40 $6,238,000 $7,600,000 19.30% N/A
1919 Portsmouth, 1903 Portsmouth, 420 W. Alabama  Houston, TX Multifamily OWNED 4/26/2019 75 $13,000,000 $14,000,000 N/A N/A
Rock Creek Albuquerque, NM Multifamily SOLD 6/28/2019 121 $6,875,000 $8,000,000 39.10% 1.48x
Pyramid Portfolio Albuquerque, NM Multifamily SOLD 6/28/2019 34 $1,905,000 $2,300,000 25.20% 1.25x
Bannister Place Austin, TX Multifamily SOLD 7/11/2019 20 $3,300,000 $4,000,000 13.21% 1.40x
The French Quarter Albuquerque, NM Multifamily SOLD 7/2/2019 84 $3,400,000 $4,480,000 16.45% 1.33x
Lexington Realty Capital Albuquerque, NM Multifamily SOLD 8/9/2019 156 $7,400,000 $11,750,000 142.16% 2.43x
The Zeno Apartments Portland, OR Multifamily OWNED 8/27/2019 22 $4,250,000 $5,000,000 N/A N/A
Cascade Apartments Austin, TX Multifamily SOLD 9/19/2019 198 $31,500,000 $38,000,000 13.90% 1.41x
Villas Esperanza Albuquerque, NM Multifamily SOLD 9/20/2019 188 $12,250,000 $19,000,000 35.60% 2.28x
Miller Square  Austin, TX Multifamily SOLD 9/1/2019 51 $8,640,000 $10,800,000 13.23% 1.42x
Chestnut Park San Antonio, TX Multifamily SOLD 12/3/2019 145 $12,000,000 $18,500,000 30.20% 1.89x
Arbors and Courtyards Albuquerque, NM Multifamily SOLD 12/23/2019 529 $38,000,000 $66,500,000 61.80% 3.04x
Barberry Village Portland, OR Multifamily SOLD 1/10/2020 180 $21,500,000 $34,000,000 36.59% 2.05x
Arcadian  Austin, TX Multifamily SOLD 2/14/2020 83 $11,350,000 $13,400,000 29.27% 1.80x
Amber Hill San Antonio, TX Multifamily SOLD 3/18/2020 244 $16,750,000 $20,700,000 52.90% 1.57x
Blue Vine Apartments San Antonio, TX Multifamily SOLD 4/27/2020 111 $10,050,000 $14,500,000 17.54% 1.39x
The Lexington Place Albuquerque, NM Multifamily SOLD 8/13/2020 156 $11,750,000 $15,752,000 35.57% 1.68x
River Park Apartments New Braunfels, TX Multifamily SOLD 9/2/2020 100 $7,800,000 $11,195,000 64.80% 1.67x
Luna Verde El Paso, TX Multifamily OWNED 9/9/2020 297 $13,500,000 $23,000,000 N/A N/A
Paso Oeste El Paso, TX Multifamily SOLD 9/9/2020 244 $15,500,000 $21,025,000 29.40% N/A
Vista Grande Albuquerque, NM Multifamily SOLD 10/19/2020 168 $11,000,000 $19,200,000 130.08% 3.80x
Mountaindale El Paso, TX Multifamily SOLD 10/1/2020 88 $5,100,000 $7,550,000 23.83% 1.34x
Creeks Edge Apartments Austin, TX Multifamily SOLD 1/4/2021 200 $23,000,000 $33,250,000 21.97% 1.32x
Netherwood Village Albuquerque, NM Multifamily SOLD 1/29/2021 220 $18,500,000 $31,500,000 366.94% 4.59x
Amber Hill - 2 San Antonio, TX Multifamily SOLD 5/25/2021 244 $27,000,000 $27,000,000 69.30% 1.73x
Raintree Village El Paso, TX Multifamily SOLD 4/15/2021 275 $15,750,000 $20,265,000 22.43% 1.44x
Evergreen Apartments Santa Fe, NM Multifamily OWNED 5/3/2021 70 $6,300,000 $8,500,000 N/A N/A
Alexis Apartments Las Cruces, NM Multifamily SOLD 6/2/2021 170 $13,235,000 $25,000,000 299.90% 4.25x
The Oasis, Speedway 38, Barton Ridge  Austin, TX Multifamily OWNED 7/21/2021 121 $21,650,000 $21,650,000 N/A N/A
Velo Apartments Spokane, WA Multifamily SOLD 6/16/2021 58 $7,900,000 $8,400,000 30.16% 1.44x
Orlo  Portland, OR Multifamily OWNED 8/6/2021 38 $5,000,000 $5,000,000 N/A N/A
Regal Ridge Spokane, WA Multifamily SOLD 8/31/2021 97 $18,250,000 $21,500,000 8.30% 1.16x
1865 Union Street San Francisco, CA Multifamily OWNED 9/30/2021 5 $4,100,000 $4,100,000 N/A N/A
The Rosewood  Spokane, WA Multifamily OWNED 12/15/2021 77 $10,500,000 $13,230,000 N/A N/A
Paso Norte, Santa Rosa, Rosetta El Paso, TX Multifamily OWNED 12/3/2021 288 $19,475,000 $24,000,000 N/A N/A
The Alexandra Lexington, KY Multifamily OWNED 2/15/2022 204 $14,000,000 $14,000,000 N/A N/A
The Lennox Spokane, WA Multifamily OWNED 3/7/2022 51 $6,600,000 $6,600,000 N/A N/A
Trinity Place/Casa Barranca El Paso, TX Multifamily OWNED 6/1/2022 429 $32,400,000 $32,400,000 N/A N/A
The Caterina/Paso Este  El Paso, TX Multifamily OWNED 6/1/2022 131 $8,825,000 $8,825,000 N/A N/A
Arabella San Antonio, TX Multifamily OWNED 7/12/2022 144 $12,700,000 $12,700,000 N/A N/A
Crescent Ridge Cincinnati, OH Multifamily OWNED 8/1/2022 154 $17,300,000 $17,300,000 N/A N/A
White Willow  Portland, OR Multifamily OWNED 9/21/2022 90 $11,700,000 $11,700,000 N/A N/A
Jackson / Morrison  Spokane, WA Multifamily OWNED 10/14/2022 111 $16,550,000 $16,550,000 N/A N/A
Elm Creek San Antonio, TX Multifamily OWNED 12/13/2022 81 $9,350,000 $9,350,000 N/A N/A
Casa Loma  Santa Fe, NM Multifamily OWNED 1/13/2023 132 $26,500,000 $26,500,000 N/A N/A
Dawn Run Lexington, KY Multifamily OWNED 4/27/2023 218 $9,100,000 $9,100,000 N/A N/A
The Izzy Oklahoma City, OK Multifamily OWNED 3/21/2023 328 $32,250,000 $32,250,000 N/A N/A
Villas on 50th Oklahoma City, OK Multifamily OWNED 5/8/2023 114 $7,300,000 $7,300,000 N/A N/A
South Hill Apartments San Antonio, TX Multifamily OWNED 10/12/2023 174 $11,700,000 $11,700,000 N/A N/A
Totals/Weighted Average         10,574 $943,192,000 $1,162,379,000    

The above bios and track record were provided by Cooper Street Capital and have not been independently verified by RealtyMogul.

Website
Management Team
Management
Brandon Cooper
Managing Partner

Brandon has spearheaded the acquisition of over $1.5 billion worth of real estate assets in the last twelve years. Prior to founding Cooper Street Capital, Brandon was the co-founder of two other real estate investment firms, including Maroon Peak Partners and I-95 Ventures. Before breaking into the real estate sector, Brandon worked as a financial advisor at Merrill Lynch and previous to that as a policy analyst at The Center for Middle East Peace in Washington, D.C. He graduated Magna Cum Laude from Bates College where he led the Bobcat’s Division I cross country ski team. 

Management
Matt Cooper
Director of Acquisitions

Prior to joining Cooper Street Capital, Matt spent several years with the US Delegation to the World Trade Organization (WTO) and the Organization for Economic Co-operation and Development (OECD) researching topics of international trade and the economics of corporate governance frameworks. Since joining, he has leveraged his analytical background to help CSC acquire over $1 billion of commercial real estate. He also holds a Bachelor of Arts in Political Science and French Language from the University of Virginia and a Masters of Science in International Political Economy from the London School of Economics.

Management
Robert Fay
Director of Investor Relations

Over the past seven years, Robert has capitalized, acquired, and repositioned over $1.25 billion worth of multifamily real estate raising and managing over $450 million in equity from family offices and high-net-worth individuals. Prior to Robert’s real estate ventures, he worked in equity research assisting in the valuation of publicly traded stocks with market caps between $30-$200 billion and for Bank of America Merrill Lynch. At Cooper Street Capital, Robert is in charge of all things Investor Relations where he works closely with the CEO and Director of Acquisition on capital events for the company and its investing partners. He graduated from the University of Colorado at Boulder with a dual degree in Economics and Psychology.

Property
For more information, view the Sponsor's Investment Memorandum.

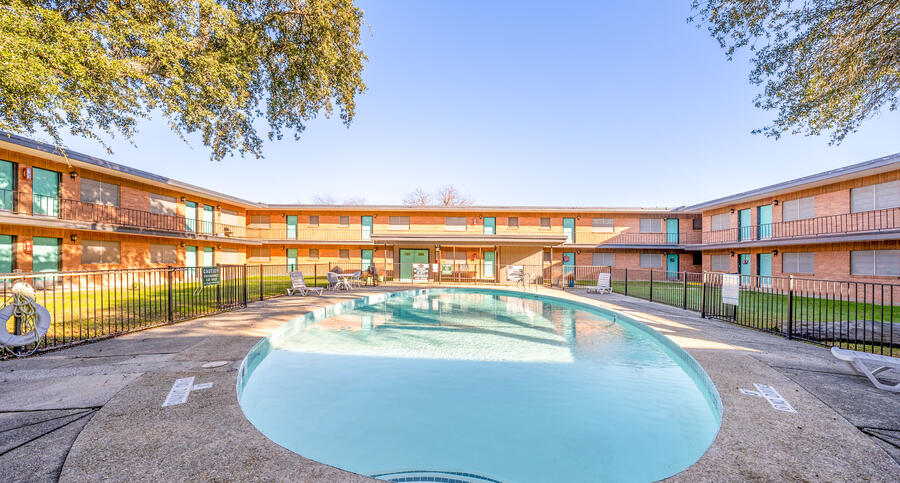
The South Hill Apartments is a 174-unit garden-style multifamily apartment community located in San Antonio's southern Brooks City Base neighborhood. The Sponsor believes that the Property boasts a desirable unit mix with an average unit size of 727 SF in addition to a noteworthy collection of amenities, including three pools, a tennis court, and ample covered parking. The Property is also strategically located just off of SE Military Drive, providing close-in access to the area's many retail and commercial destinations, while it sits within a short distance to US Highway 281, thereby providing excellent connectivity to the city's major employers. 

Unit Mix

Unit Type Avg SF/Unit Avg Rent Rent PSF Avg Rent (In-Place) Rent PSF (In-Place) Lease Type
Studio 485 $745 $1.54 $741 $1.53 NMI
1 BD / 1 BA (Small) 520 $835 $1.61 $820 $1.58 NMI
1 BD / 1 BA (Large) 720 $930 $1.29 $896 $1.24 NMI
2 BD / 2 BA (Small) 800 $1,050 $1.31 $945 $1.18 NMI
2 BD / 2 BA (Large) 920 $1,050 $1.14 $1,038 $1.13 NMI
2 BD / 2 BA (XL) 940 $1,050 $1.12 $1,078 $1.15 NMI
2 BD / 2.5 BA 1,040 $1,080 $1.04 $1,067 $1.03 NMI
3 BD / 1.5 BA 1,100 $1,300 $1.18 $1,161 $1.06 NMI
Totals / Averages 727 $939 $1.29 $919 $1.26  
Comparables
For more information, view the Sponsor's Investment Memorandum.

Sales Comparables

  Ivy Plains Seven Pines Amber Hill The Establishment Villa de Oro Arcos RiverBend Willow Run Averages South Hill Apartments (Going-in)
Sale Date 05-15-2022 06-15-2022 06-15-2022 08-15-2022 09-15-2022 02-15-2022 04-15-2023 09-01-2022    
Sale Price $15,500,000 $9,500,000 $27,100,000 $13,642,000 $17,000,000 $13,400,000 $18,000,000 $12,700,000 $15,855,250 $11,700,000
Year Built 1974 1969 1969 1969 1987 1970 1984 1960 1972 1965
# of Units 135 87 244 144 150 117 200 154 154 174
Average Unit Size 735 SF 695 SF 788 SF 744 SF 603 SF 771 SF 730 SF 867 SF 742 SF 727 SF
Sales Price / Unit $114,815 $109,195 $111,066 $94,736 $113,333 $114,530 $90,000 $82,468 $103,768 $67,241
Sales Price / SF $156 $157 $141 $127 $188 $149 $123 $95 $142 $93
Distance from Subject Property 1.4 mi 6.1 mi 17.5 mi 10.0 mi 6.9 mi 16.8 mi 3.5 mi 12.9 mi 9.4 mi  


Lease Comparables

  Highland Hills Brooksfield Apartments Ivy Plains at Brooks Salem Creek RiverBend The Aliso Ridge at Southcross Averages South Hill Apartments
Distance from Subject Property 2.0 mi 1.1 mi 1.4 mi 3.2 mi 3.5 mi 3.3 mi 2.3 mi 2.4 mi  
Year Built 1956 1987 1978 1985 1984 1965 1974 1975 1965
Number of Units 176 156 135 75 200 176 210 161 174
                   
1 Bedrooms               Averages Market Rent (Target Rent)
$ / Unit $820 $999 $1,149 $1,041 $811 $999 $795 $945 $835
Square Feet 529 SF 500 SF 667 SF 560 SF 516 SF 640 SF 618 SF 576 SF 520 SF
$ / SF $1.55/SF $2.00/SF $1.72/SF $1.86/SF $1.57/SF $1.56/SF $1.29/SF $1.65/SF $1.61/SF
                   
1 Bedrooms                  
$ / Unit $840 $1,098 N/A $1,066 $765 $945 N/A $943 $930
Square Feet 546 SF 675 SF N/A 678 SF 678 SF 740 SF N/A 663 SF 720 SF
$ / SF $1.54/SF $1.63/SF N/A $1.57/SF $1.13/SF $1.28/SF N/A $1.43/SF $1.29/SF
                   
2 Bedrooms                  
$ / Unit $965 $1,170 $1,371 $1,354 $869 $1,213 $965 $1,130 $1,050
Square Feet 682 SF 790 SF 971 SF 844 SF 837 SF 840 SF 861 SF 832 SF 920 SF
$ / SF $1.41/SF $1.48/SF $1.41/SF $1.60/SF $1.04/SF $1.44/SF $1.12/SF $1.36/SF $1.14/SF
                   
2 Bedrooms                  
$ / Unit $913 N/A N/A $1,386 $924 N/A $1,292 $1,129 $1,080
Square Feet 694 SF N/A N/A 901 SF 910 SF N/A 1,132 SF 909 SF 1,040 SF
$ / SF $1.32/SF N/A N/A $1.54/SF $1.02/SF N/A $1.14/SF $1.25/SF $1.04/SF
Financials
For more information, view the Sponsor's Investment Memorandum.
Sources & Uses

Total Capitalization

Sources of Funds $ Amount $/Unit
GP Equity(1) $500,000 $2,874
LP Equity $4,324,000 $24,851
Senior Loan $8,925,000 $51,293
Total Sources of Funds $13,749,000 $79,017
     
Uses of Funds $ Amount $/Unit
Purchase Price $11,700,000 $67,241
Acquisition Fee (1%) $117,000 $672
CapEx $1,347,000 $7,741
Closing Costs(2) $585,000 $3,362
Total Uses of Funds $13,749,000 $79,017

(1) The Sponsor’s equity contribution may consist of friends and family equity and equity from funds controlled by the Sponsor.

(2) RM Technologies, LLC, an affiliate of RealtyMogul, operates the RealtyMogul Platform. RM Technologies, LLC charges a fixed, non-percentage-based fee for real estate companies and their sponsors to use the Platform and for Platform-related services. Please see the Fees and Disclaimers sections below for additional information concerning fees paid to RM Technologies, LLC. 

Debt Assumptions

The expected terms of the debt financing are as follows:

  • Lender: Fannie Mae
  • Loan Type: Permanent Loan
  • Term: 84 Months
  • Loan-to-Value (LTV): 76.3% 
  • Loan-to-Cost (LTC): 64.9%
  • Estimated Proceeds: $8,925,000
  • Interest Type: Fixed
  • Annual Interest Rate: 153 bps over 7-year Treasury (Indicative Rate, Fixed Rate to be set prior to Closing)
  • Interest-Only Period: 84 Months
  • Prepayment Terms: Yield Maintenance
  • Extension Requirements: N/A
  • Recourse Description: Non-Recourse

(1) A substantial portion of the total acquisition for the Property will be paid with borrowed funds, i.e., debt.  Please carefully review the Disclaimers section below for additional information concerning the Sponsors use of debt. 

Distributions

Cooper Street Capital intends to make distributions from CSC South Hill Realty Capital, LLC as follows:

  1. Pari passu all cash flow available for distribution to the Equity Investors(1) until the Equity Investors receive a Preferred Return of 10.0% IRR;
  2. 70% / 30% (70% to LP Equity Investors(2) / 30% to GP Equity Investors(3)) of all cash flow available for distribution thereafter.

Cooper Street Capital intends to make distributions to investors after the payment of the company's liabilities (loan payments, operating expenses, and other fees as more specifically set forth in the LLC agreements, in addition to any member loans or returns due on member loan).

Distributions are expected to start in July 2024 and are projected to continue on a quarterly basis thereafter. Distributions are at the discretion of Cooper Street Capital, who may decide to delay distributions for any reason, including maintenance or capital reserves.

Cooper Street Capital will receive a promoted/carried interest as indicated above.

Cash Flow Summary
    Year 1 Year 2 Year 3
Effective Gross Revenue   $2,032,400 $2,186,644 $2,252,810
Total Operating Expenses   ($1,219,875) ($1,282,768) ($1,296,896)
Net Operating Income   $812,525 $903,876 $955,914
         
Project-Level Cash Flows
  Year 0 Year 1 Year 2 Year 3
Net Cash Flow ($4,824,000) $306,796 $398,148 $7,662,748
         
Investor-Level Cash Flows(4)
  Year 0 Year 1 Year 2 Year 3
Net Cash Flow ($2,000,000) $127,196 $155,070 $2,896,169
         
Investor-Level Cash Flows - Hypothetical $50,000 Investment(4)
  Year 0 Year 1 Year 2 Year 3
Net Cash Flow ($50,000) $3,180 $3,877 $72,404


(1) Equity Investors include all members part of the Limited Partnership and General Partnership, including Cooper Street Capital.

(2) LP Equity Investors include members part of the Limited Partnership.

(3) GP Equity Investors include members part of the General Partnership, including Cooper Street Capital.

(4) RM Technologies, LLC and its affiliates do not provide any assurance of returns.  Returns presented are net of all fees.  Please carefully review the Fees and Disclaimers sections below for additional information concerning Sponsor’s use or projected returns and fees paid to Sponsor and RM Technologies, LLC.


Fees

Certain fees and compensation will be paid over the life of the transaction; please refer to Cooper Street Capital's materials for details. The following fees and compensation will be paid(1)(2):

One-Time Fees:
Type of Fee Amount of Fee Received By Paid From
Acquisition Fee 1.0% of Purchase Price Sponsor Affiliate Capitalized Equity Contribution
Mortgage Brokerage Fee 1.0% of Loan Proceeds Sponsor Affiliate Capitalized Equity Contribution
Financing Fee 1.0% of Loan Fees Sponsor/Sponsor Affiliate Capitalized Equity Contribution
Technology Solution Licensing Fee(xx) Flat one-time licensing fees of $15,000 plus $1,500 per each prospective investor onboarded by Sponsor through its license and use of RM Technologies’ Technology Solution RM Technologies, LLC

Capitalization (at Sponsor’s discretion)

       
Recurring Fees:
Type of Fee Amount of Fee Received By Paid From
Property Management Fee 2.5% of Gross Rental Income Sponsor/Sponsor Affiliate Cash Flow
Asset Management Fee 0.5% of Gross Rental Income Sponsor/Sponsor Affiliate Cash Flow
Construction Management Fee 5.0% of Total Costs Before Contingency CSC Management, LLC Construction Expenditure Budget
Administration Solution Licensing Fee Flat quarterly licensing fee of $125 per investor serviced by Sponsor through the license and use of  RM Technologies’ Administration Solution RM Technologies, LLC Cash Flow

(1) Fees may be deferred to reduce impact to investor distributions.

(2) Please see the Fees and Disclaimers sections below for additional information concerning fees paid to RM Technologies, LLC.

Disclosures
RM Securities, LLC and its Affiliates Compensation

RM Securities, LLC, its registered representatives, affiliates, associated persons, and personnel of its affiliates who may also be associated with it, including our associated persons and personnel of our affiliates who are also be associated with RM Securities, LLC (it (“RM Securities,” “we,” “our,” or “us”) will receive fees, expense reimbursements, and other compensation (“Fees”) from the issuer of this investment offering, its sponsor, or an affiliate thereof (“Sponsor”), or otherwise in connection with Sponsor’s offering. The Fees paid to us are in addition to other fees you will pay to Sponsor or in connection with Sponsor’s investment offering. You will pay Fees to Sponsor, either directly or indirectly as an investor in the Sponsor’s offering. Sponsor will use the Fees you pay, as well as funds you invest in the relevant offering, to compensate us. The Fees paid to us will directly or indirectly be borne by you as the investor (typically, but not always, in the form of an expense of the Sponsor’s offering in which you invest) because such Fees will reduce the proceeds available for distribution to you and reduce the amount you earn over time.

For more information on the Fees paid to us, or any other Fees you will pay in connection with Sponsor’s offering, please carefully review the Sponsor’s Investment Documents. Please also carefully review RM Securities’ Form CRS, Regulation Best Interest Disclosures, and Limited Brokerage Services Agreement.

No Approval, Opinion or Representation, or Warranty by RM Securities, LLC

Sponsor has provided, approved, and is solely responsible in all aspects for the information on this webpage (“Page”), including Sponsor’s offering documentation, which may include without limitation the Private Placement Memorandum, Operating or Limited Partnership Agreement, Subscription Agreement, the Project Summary and all exhibits and other documents attached thereto or referenced therein (collectively, the “Investment Documents”). The Investment Documents linked on this page have been prepared and posted by Sponsor, and not by RM Securities. We did not assist in preparing, do not adopt or endorse, and we are not otherwise responsible for, the Sponsor’s Investment Documents. We make no representations or warranties as to the accuracy of information on this Page or in the Sponsor’s Investment Documents and we accept no liability therefor. No part of the information on this Page or in the Sponsor’s Investment Documents is intended to be binding on us.

Sponsor’s Information Qualified by Investment Documents

The information on this Page is qualified in its entirety by reference to the more complete information about the offering contained in the Sponsor’s Investment Documents. The information on this Page is not complete and subject to change at the Sponsor’s discretion at any time up to the closing date. The Sponsor’s Investment Documents and supplements thereto contain important information about the Sponsor’s offering including relevant investment objectives, the business plan, risks, charges, expenses, and other information, which you should consider carefully before investing. The information on this Page should not be used as a basis for an investor’s decision to invest.

Risk of Investment

This investment is speculative, highly illiquid, and involves substantial risk. There can be no assurances that all or any of Sponsor’s assumptions, expectations, estimates, goals, hypothetical illustrations, or other aspects of Sponsor’s business plans (“Assumptions”) will be true or that actual performance will bear any relation to Sponsor’s Assumptions, and no guarantee or representation is made that Sponsor’s Assumptions will be achieved. If Sponsor does not achieve its Assumptions, your investment could be materially and adversely affected. A loss of part or all of the principal value of your investment may occur. You should not invest unless you can readily bear the consequences of such loss. Sponsor’s Assumptions should not be relied upon as the primary basis for your decision to invest.

No Reliance on Forward-Looking Statements; Sponsor Assumptions

Sponsor is solely responsible for statements made concerning forward-looking statements and Assumptions, which apply only as of the date made, are preliminary and subject to change, and are expressly qualified in their entirety by the disclosures and cautionary statements included in Sponsor’s Investment Documents, which you should carefully review. Neither RM Securities nor Sponsor are obligated to update or revise such forward-looking statements or Assumptions to reflect events or circumstances that arise after the date made or to reflect the occurrence of unanticipated events. Sponsor’s forward-looking statements and Assumptions are hypothetical, not based on actual investment achievements or events, and are presented solely for purposes of providing insight into the Sponsor’s investment objectives, detailing Sponsor’s anticipated risk and reward characteristics, and establishing a benchmark for future evaluation of actual results; therefore, they are not a predictor, projection, or guarantee of future results. You should not rely on Sponsor’s forward-looking statements as a basis to invest.

Importantly, we do not adopt, endorse, or provide any assurance of returns or as to the accuracy or reasonableness of Sponsor’s Assumptions or forward-looking statements.

No Reliance on Past Performance

Any description of past performance is not a reliable indicator of future performance and should not be relied upon as the primary basis to invest.

Sponsor’s Use of Debt

A substantial portion of the total cost of the real estate asset acquired by the Sponsor with investor funds (“Property”) will be paid with borrowed funds, i.e., debt. Sponsor’s estimated rates and terms of the debt financing are subject to lender approval, and there is no assurance that the Sponsor will secure debt at the rates and terms presented on this Page or in the Sponsor’s Investment Documents, or at all. The use of borrowed money to acquire real estate is referred to as leveraging, which can amplify losses and could result in lender foreclosure. In addition, if the debt includes a variable (or “floating”) interest rate, the total amount of interest paid over the term of the debt will fluctuate and can increase. As a result, Sponsor’s use of debt can result in a loss of some or all of your investment.

Sponsor’s Offering is Not Registered

Sponsor’s securities offering will not be registered under the Securities Act of 1933, as amended (the “Securities Act”), in reliance upon the exemptions from registration pursuant to Rule 506(c) of Regulation D as promulgated under the Securities Act (“Private Placement”). In addition, the offering will not be registered under any state securities laws in reliance on exemptions from state registration. Such securities (your ownership interests) are subject to restrictions on transferability and resale and may not be transferred or resold except as permitted under applicable state and federal securities laws pursuant to registration or an available exemption. All Private Placements on the Platform are intended solely for “Accredited Investors,” as that term is defined in Rule 501(a) under the Securities Act.

No Investment Advice

Nothing on this Page should be regarded as investment advice (either with respect to a particular security or regarding an overall investment strategy), a recommendation, an offer to sell, or a solicitation of or an offer to buy any security. Advice from a securities professional is strongly advised to understand and assess the risks associated with real estate or private placement investments. For additional information on RM Securities’ involvement in this offering, please carefully review the Sponsor’s Investment Documents, and RM Securities’ Form CRS, Regulation Best Interest Disclosures, and Limited Brokerage Services Agreement.

1031 Exchange Risk

Internal Revenue Code Section 1031 (“Section 1031”) contains complex tax concepts and certain tax consequences may vary depending on the individual circumstances of each investor. RM Securities and its affiliates make no representation or warranty of any kind with respect to the tax consequences of your investment or that the IRS will not challenge any such treatment. You should consult with and rely on your own tax advisor about the tax aspects with respect to your particular circumstances.

JOIN REALTYMOGUL
Create an account or sign in.
Are you an Accredited Investor?
Must be 8 characters or more with an uppercase and lowercase character, a number, and a symbol.
By clicking "JOIN REALTYMOGUL" you are agreeing to our Terms of Service and Privacy Policy, and that you've had an opportunity to review RM Securities, LLC's Form Customer Relationship Summary.
SIGN IN
Don’t have an account yet? Join RealtyMogul.
Forgot Password?
Questions? Our Investor Relations team is available to help 9 AM - 8 PM ET Monday to Friday. Contact us at (877) 977-2776.
Forgot Password
Enter your email address to receive a code to reset your password.
Enter the code sent to your email address below and your new password.

Resend Code

WELCOME
Welcome,

Welcome to RealtyMogul! We need to ask a few additional questions to get to know you.

Your Net Worth
Are you interested in 1031 exchanges?
Thank you!

We’ve received your information and updated your Investor Profile.

Welcome to RealtyMogul

As part of RealtyMogul's commitment to transparency, we want to inform you that you have been directed to our website from an unaffiliated third-party marketing company who is compensated up to $250 for each investor who registers on our site. RealtyMogul and its affiliates have no relationship with the marketing company other than this compensation arrangement. RealtyMogul and its affiliates are not responsible for the preparation or accuracy of, and do not explicitly or implicitly adopt or endorse, any content provided by the unaffiliated marketing company.