


Co-Founded in 1996 by Lance and Sadie Williams. Williams Communities and Williams Homes (collectively “Williams”) primary focus is the development and sale of single-family attached and detached homes in communities targeted to entry-level, move-up, and luxury homebuyers in California, Idaho, Texas, and Montana. Williams consistently lands in the top ten most active for-sale homebuilders in its established markets. Over the past quarter century, Lance Williams has come to be recognized as a leader in the housing industry in the West. Lance K. Williams is the Chief Executive Officer of Williams Communities, LLC. Mr. Williams, in addition to the individuals listed in the management profile herein, will be responsible for managing the day-to-day business of the Company. In 2021 Williams delivered 398 homes for nearly $300 million in revenue with an average sales price of $760,000. Over its twenty-five-year history, Williams has delivered over 2,500 homes in 60 communities worth in excess of $1.3 billion and currently has in process or under construction over 3,300 homes with a completed value of approximately $2.2 billion. Williams has a perfect record of project completion. Williams has historically capitalized its projects with traditional commercial bank financing, institutional equity, and high net worth individual equity.
To date, Williams’ equity partners have invested over $400 million in Williams projects with completed projects having averaged a 23% annualized internal rate of return and a 1.4 multiple.
This is an increasingly rare opportunity to build and sell 155 market-rate, single-family attached and detached homes in a master-planned setting with no entitlement risk in the City of Bozeman, Montana. The project has all the required entitlements. The architectural plan approvals are in-process, and development is expected to begin in early 2023. The property is owned by the Company, and revolver loan financing was arranged and recorded with Stockman Bank to fund the remaining development and construction costs.
Unit Mix
| Cost | Sale | ||||||
| Unit Type | # of Units | Avg SF/Unit | $ / Unit | $ / SF | $ / Unit | $ / SF | |
| Plan 1 | Small Lot Detached | 41 | 2,062 | $558,067 | $270.64 | $667,000 | $323.47 |
| Plan 2 | Small Lot Detached | 41 | 2,359 | $638,449 | $270.64 | $709,000 | $300.55 |
| Plan 3 | Alley Loaded SFD | 17 | 1,882 | $509,351 | $270.64 | $618,000 | $328.37 |
| Plan 4 | Alley Loaded SFD | 7 | 2,008 | $543,453 | $270.64 | $643,000 | $320.22 |
| Plan 5 | Alley Loaded SFD w/ADU | 8 | 2,455 | $664,430 | $270.64 | $692,000 | $281.87 |
| Plan 6 | Alley Loaded SFD | 13 | 2,312 | $625,728 | $270.64 | $672,000 | $290.66 |
| Plan 7 | Duplex | 14 | 1,690 | $457,388 | $270.64 | $547,000 | $323.67 |
| Plan 8 | Duplex | 14 | 1,827 | $494,466 | $270.64 | $566,000 | $309.80 |
| Total/Averages | 155 | 2,105 | $569,653 | $270.64 | $653,400 | $311.68 | |
Sales Comparables
| DUPLEX Units | 2307 Blue Silos Way | 2316 Gallatin Green #17 | 2310 Gallatin Green #15 | 202 Albrey Trail #A | 2930 W. Babcock #B | 2934 W. Babcock #A | Average | Subject | ||
| Status | Active | Active | Under Contract | Active | Under Contract | Under Contract | Future | |||
| Year Built | 2023 | 2021 | 2022 | 2022 | 2023 | 2022 | 2022 | 2024 | ||
| # of Units | 1 | 1 | 1 | 1 | 1 | 1 | 1 | 2 | ||
| Average Unit Size | 1,507 SF | 1,530 SF | 1,540 SF | 1,703 SF | 1,753 SF | 1,753 SF | 1,631 SF | 1,759 SF | ||
| Sale Price | $724,900 | $505,000 | $519,000 | $699,900 | $529,000 | $534,900 | $585,450 | $556,500 | ||
| $/Unit | $724,900 | $505,000 | $519,000 | $699,900 | $529,000 | $534,900 | $585,450 | $556,500 | ||
| $/SF | $481 | $330 | $337 | $411 | $302 | $305 | $361 | $316 | ||
| Cap Rate | NA | NA | NA | NA | NA | NA | NA | NA | ||
| Building Size | 1,507 SF | 1,530 SF | 1,540 SF | 1,703 SF | 1,753 SF | 1,753 SF | 1,631 SF | 1,759 SF | ||
| Distance from subject (miles) | 1 NE | 1 NW | 1 NW | 2 SE | 1 NW | 1 NW | 1.2 mi | |||
| ALLEY HOMES | 5434 May Fly | 123 Stallion Dr | 321 Stone Fly | 4267 Benepe | 119 Laurel Parkway | 3914 Kimberwicke St | Average | Subject | ||
| Status | Sold | Active | Active | Active | Under Contract | Sold | Future | |||
| Year Built | 2018 | 2023 | 2014 | 2006 | 2017 | 2009 | 2015 | 2024 | ||
| # of Units | 1 | 1 | 1 | 1 | 1 | 1 | 1 | 4 | ||
| Average Unit Size | 1,649 SF | 1,774 SF | 1,527 SF | 1,594 SF | 1,850 SF | 1,784 SF | 1,696 SF | 2,164 SF | ||
| Sale Price | $595,000 | $675,000 | $559,000 | $624,900 | $675,000 | $589,950 | $619,808 | $656,250 | ||
| $/Unit | $595,000 | $675,000 | $559,000 | $624,900 | $675,000 | $589,950 | $619,808 | $656,250 | ||
| $/SF | $361 | $380 | $366 | $392 | $365 | $331 | $366 | $303 | ||
| Cap Rate | NA | NA | NA | NA | NA | NA | NA | NA | ||
| Building Size | 1,649 SF | 1,774 SF | 1,527 SF | 1,594 SF | 1,850 SF | 1,784 SF | 1,696 SF | 2,164 SF | ||
| Distance from subject (miles) | 1 NW | 2 NW | 1 NW | 1 NW | 1 NW | 1 NW | 1.2 mi | |||
| SINGLE-FAMILY HOMES | 1505 Ryun Sun Way | 91 Hyalite Peak Dr | 540 Westgate | 347 Herstall Way | 11 Marten Peark Ct | 160 Stone Fly | Average | Subject | ||
| Status | Active | Sold | Active | Sold | Sold | Sold | Future | |||
| Year Built | 2018 | 2022 | 2017 | 2020 | 2020 | 2012 | 2018 | 2024 | ||
| # of Units | 1 | 1 | 1 | 1 | 1 | 1 | 1 | 2 | ||
| Average Unit Size | 2,282 SF | 2,178 SF | 2,228 SF | 2,153 SF | 2,427 SF | 2,148 SF | 2,236 SF | 2,211 SF | ||
| Sale Price | $950,000 | $870,000 | $799,000 | $799,000 | $745,000 | $760,000 | $820,500 | $688,000 | ||
| $/Unit | $950,000 | $870,000 | $799,000 | $799,000 | $745,000 | $760,000 | $820,500 | $688,000 | ||
| $/SF | $416 | $399 | $359 | $371 | $307 | $354 | $368 | $311 | ||
| Cap Rate | NA | NA | NA | NA | NA | NA | NA | NA | ||
| Building Size | 2,282 SF | 2,178 SF | 2,228 SF | 2,153 SF | 2,427 SF | 2,148 SF | 2,236 SF | 2,211 SF | ||
| Distance from subject (miles) | 1 NW | 2 SW | 1 NW | 1 NW | 2 SW | 1 NW | 1.3 mi | |||
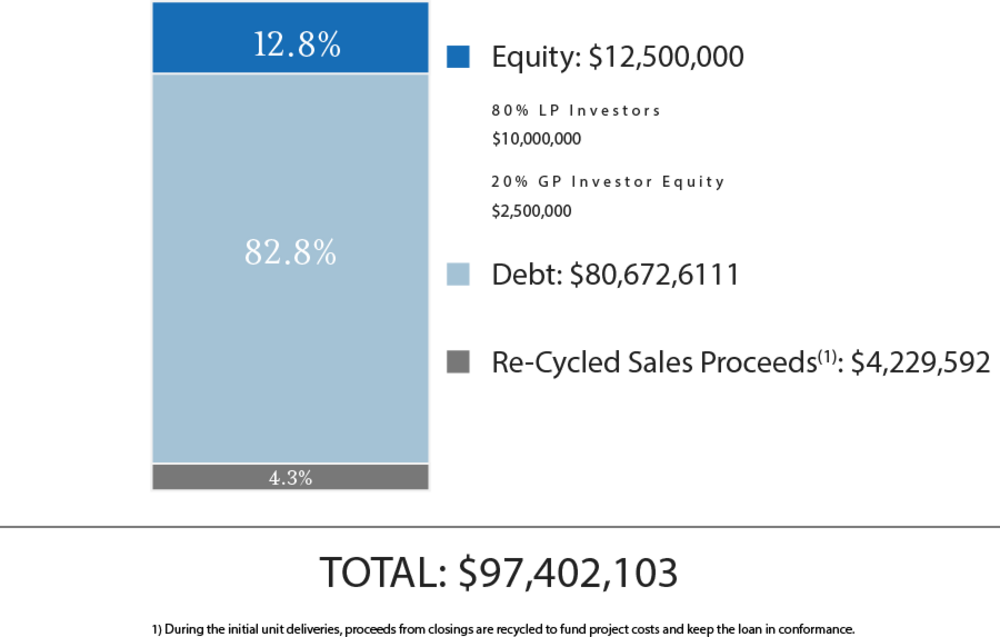
Total Capitalization
| Sources of Funds | $ Amount | $/Unit |
| Debt | $80,672,511 | $520,468 |
| GP Investor Equity(1) | $2,500,000 | $16,129 |
| LP Investor Equity | $10,000,000 | $64,516 |
| Re-Cycled Sales Proceeds(2) | $4,229,592 | $27,288 |
| Total Sources of Funds | $97,402,103 | $628,401 |
| Uses of Funds | $ Amount | $/Unit |
| Land Acquisition Price(3) | $9,878,379 | $63,731 |
| Development Fee | $2,791,142 | $18,007 |
| Loan & Technology Services Fees(4) | $532,256 | $3,434 |
| Closing Costs | $51,925 | $335 |
| Hard Costs | $62,975,657 | $406,295 |
| Hard Cost Contingency | $1,260,291 | $8,131 |
| Soft Costs | $7,093,483 | $45,764 |
| Soft Cost Contingency | $1,038,510 | $6,700 |
| G & A Costs | $4,154,038 | $26,800 |
| Financing Costs Interest | $2,769,798 | $17,870 |
| Warranty | $778,882 | $5,025 |
| Other Costs - Marketing & Sales | $4,077,742 | $26,308 |
| Total Uses of Funds | $97,402,103 | $628,401 |
(1) The Sponsor’s equity contribution may consist of friends and family equity and equity from funds controlled by the Sponsor.
(2) During the initial unit deliveries, proceeds from closings are recycled to fund project costs and keep the loan in conformance.
(3) There were shared, offsite infrastructure costs included in the purchase price and paid at closing.
(4) Please see the Fees and Disclaimers sections below for additional information concerning fees paid to RM Technologies, LLC.
The terms of the debt financing are as follows:
- Lender: Stockman Bank
- Term: Two years, three one-year extensions
- Loan-to-Cost: 50% Land, 65% Land Development, 75% Vertical Construction
- Commitment (Revolver): $30,000,000
- Estimated Proceeds(1): $80,672,511
- Interest Type: Floating
- Spread above Prime: 0.50%
- Interest-Only Period: 2 years
- Amortization: None, Revolving Credit Facility
- Prepayment Terms: Repaid from each home closing at 115% of par for lot advances, plus the par amount of vertical construction advances.
- Extension Requirements: Project is performing and no material adverse change with respect to collateral and guarantor.
(1) The difference between the proceeds and commitment is due to the loan being a revolving credit facility and proceeds being borrowed and repaid throughout the construction cycle.
(2) A substantial portion of the total acquisition for the Property will be paid with borrowed funds, i.e., debt. Please carefully review the Disclaimers section below for additional information concerning the Sponsors use of debt.
Williams Homes intends to make distributions from WH Bozeman NWX 358 LLC as follows:
- First, to the Members, pro rata, based on their respective unreturned Capital Contributions until fully paid and returned;
- Second, to the Members, pro rata, based on their respective Capital Contributions, the Preferred Return thereon until said Preferred Return is fully paid;
- Third, the remaining Distributable Cash shall be distributed as follows: (1) thirty-five percent (35%) to the Members, pro rata, based on their respective Percentage Interests; and (2) sixty-five percent (65%) to the Manager.
"Preferred Return" shall mean and refer to a return of twelve percent (12%) per annum, compounding, on unreturned Capital Contributions from the date on which the Capital Contributions are funded.
Williams Homes intends to make distributions to investors after the payment of the company's liabilities (loan payments, operating expenses, and other fees as more specifically set forth in the LLC agreements, in addition to any member loans or returns due on member loan).
Distributions are expected to start in May 2024 and are projected to continue on a quarterly basis thereafter. Distributions are at the discretion of Williams Homes, who may decide to delay distributions for any reason, including maintenance or capital reserves.
Williams Homes will receive a promoted/carried interest as indicated above.
| Project-Level Cash Flows | ||||||
| Year 0 | Year 1(1) | Year 2 | Year 3 | |||
| Net Cash Flow | ($12,500,000) | $4,793,316 | $8,571,017 | $14,199,341 | ||
| Investor-Level Cash Flows(2) | ||||||
| Year 0 | Year 1 | Year 2 | Year 3 | |||
| Net Cash Flow | ($4,500,000) | $1,675,594 | $3,035,566 | $2,037,024 | ||
| Investor-Level Cash Flows - Hypothetical $50,000 Investment(2) | ||||||
| Year 0 | Year 1 | Year 2 | Year 3 | |||
| Net Cash Flow | ($50,000) | $18,618 | $33,729 | $22,634 | ||
(1) Year 1 cash flow includes land sale and shared site cost incurred for 203 paper lots that will be sold to an affiliated party.
(2) RM Technologies, LLC and its affiliates do not provide any assurance of returns. Returns presented are net of all fees. Please carefully review the Fees and Disclaimers sections below for additional information concerning Sponsor’s use or projected returns and fees paid to Sponsor and RM Technologies, LLC.
Certain fees and compensation will be paid over the life of the transaction; please refer to Williams Homes' materials for details. The following fees and compensation will be paid(1)(2):
| One-Time Fees: | |||
| Type of Fee | Amount of Fee | Received By | Paid From |
| Construction Management Fee | 4.0% of Gross Revenue | Williams Homes | Equity/Loan |
| Sales Commission | 1.5% of Gross Revenue | Williams Homes | Closing Proceeds |
| Warranty | 1.0% of Gross Revenue | Williams Homes | Closing Proceeds |
| Acquisition Fee | $45,000 | Williams Homes | Equity/Loan |
| Technology Solution Licensing Fee(1) | Flat one-time licensing fees of $15,000 plus $1,500 per each prospective investor onboarded by Sponsor through its license and use of RM Technologies’ Technology Solution | RM Technologies, LLC |
Capitalization (at Sponsor’s discretion) |
| Recurring Fees: | |||
| Type of Fee | Amount of Fee | Received By | Paid From |
| Administration Solution Licensing Fee(1) | Flat quarterly licensing fee of $125 per investor serviced by Sponsor through the license and use of RM Technologies’ Administration Solution | RM Technologies, LLC | Cash Flow |
(1) Please see the Fees and Disclaimers sections below for additional information concerning fees paid to RM Technologies, LLC.
(2) Fees may be deferred to reduce impact to investor distributions.
RM Securities, LLC, its registered representatives, affiliates, associated persons, and personnel of its affiliates who may also be associated with it, including our associated persons and personnel of our affiliates who are also be associated with RM Securities, LLC (it (“RM Securities,” “we,” “our,” or “us”) will receive fees, expense reimbursements, and other compensation (“Fees”) from the issuer of this investment offering, its sponsor, or an affiliate thereof (“Sponsor”), or otherwise in connection with Sponsor’s offering. The Fees paid to us are in addition to other fees you will pay to Sponsor or in connection with Sponsor’s investment offering. You will pay Fees to Sponsor, either directly or indirectly as an investor in the Sponsor’s offering. Sponsor will use the Fees you pay, as well as funds you invest in the relevant offering, to compensate us. The Fees paid to us will directly or indirectly be borne by you as the investor (typically, but not always, in the form of an expense of the Sponsor’s offering in which you invest) because such Fees will reduce the proceeds available for distribution to you and reduce the amount you earn over time.
For more information on the Fees paid to us, or any other Fees you will pay in connection with Sponsor’s offering, please carefully review the Sponsor’s Investment Documents. Please also carefully review RM Securities’ Form CRS, Regulation Best Interest Disclosures, and Limited Brokerage Services Agreement.
No Approval, Opinion or Representation, or Warranty by RM Securities, LLCSponsor has provided, approved, and is solely responsible in all aspects for the information on this webpage (“Page”), including Sponsor’s offering documentation, which may include without limitation the Private Placement Memorandum, Operating or Limited Partnership Agreement, Subscription Agreement, the Project Summary and all exhibits and other documents attached thereto or referenced therein (collectively, the “Investment Documents”). The Investment Documents linked on this page have been prepared and posted by Sponsor, and not by RM Securities. We did not assist in preparing, do not adopt or endorse, and we are not otherwise responsible for, the Sponsor’s Investment Documents. We make no representations or warranties as to the accuracy of information on this Page or in the Sponsor’s Investment Documents and we accept no liability therefor. No part of the information on this Page or in the Sponsor’s Investment Documents is intended to be binding on us.
Sponsor’s Information Qualified by Investment DocumentsThe information on this Page is qualified in its entirety by reference to the more complete information about the offering contained in the Sponsor’s Investment Documents. The information on this Page is not complete and subject to change at the Sponsor’s discretion at any time up to the closing date. The Sponsor’s Investment Documents and supplements thereto contain important information about the Sponsor’s offering including relevant investment objectives, the business plan, risks, charges, expenses, and other information, which you should consider carefully before investing. The information on this Page should not be used as a basis for an investor’s decision to invest.
Risk of InvestmentThis investment is speculative, highly illiquid, and involves substantial risk. There can be no assurances that all or any of Sponsor’s assumptions, expectations, estimates, goals, hypothetical illustrations, or other aspects of Sponsor’s business plans (“Assumptions”) will be true or that actual performance will bear any relation to Sponsor’s Assumptions, and no guarantee or representation is made that Sponsor’s Assumptions will be achieved. If Sponsor does not achieve its Assumptions, your investment could be materially and adversely affected. A loss of part or all of the principal value of your investment may occur. You should not invest unless you can readily bear the consequences of such loss. Sponsor’s Assumptions should not be relied upon as the primary basis for your decision to invest.
No Reliance on Forward-Looking Statements; Sponsor AssumptionsSponsor is solely responsible for statements made concerning forward-looking statements and Assumptions, which apply only as of the date made, are preliminary and subject to change, and are expressly qualified in their entirety by the disclosures and cautionary statements included in Sponsor’s Investment Documents, which you should carefully review. Neither RM Securities nor Sponsor are obligated to update or revise such forward-looking statements or Assumptions to reflect events or circumstances that arise after the date made or to reflect the occurrence of unanticipated events. Sponsor’s forward-looking statements and Assumptions are hypothetical, not based on actual investment achievements or events, and are presented solely for purposes of providing insight into the Sponsor’s investment objectives, detailing Sponsor’s anticipated risk and reward characteristics, and establishing a benchmark for future evaluation of actual results; therefore, they are not a predictor, projection, or guarantee of future results. You should not rely on Sponsor’s forward-looking statements as a basis to invest.
Importantly, we do not adopt, endorse, or provide any assurance of returns or as to the accuracy or reasonableness of Sponsor’s Assumptions or forward-looking statements.
No Reliance on Past PerformanceAny description of past performance is not a reliable indicator of future performance and should not be relied upon as the primary basis to invest.
Sponsor’s Use of DebtA substantial portion of the total cost of the real estate asset acquired by the Sponsor with investor funds (“Property”) will be paid with borrowed funds, i.e., debt. Sponsor’s estimated rates and terms of the debt financing are subject to lender approval, and there is no assurance that the Sponsor will secure debt at the rates and terms presented on this Page or in the Sponsor’s Investment Documents, or at all. The use of borrowed money to acquire real estate is referred to as leveraging, which can amplify losses and could result in lender foreclosure. In addition, if the debt includes a variable (or “floating”) interest rate, the total amount of interest paid over the term of the debt will fluctuate and can increase. As a result, Sponsor’s use of debt can result in a loss of some or all of your investment.
Sponsor’s Offering is Not RegisteredSponsor’s securities offering will not be registered under the Securities Act of 1933, as amended (the “Securities Act”), in reliance upon the exemptions from registration pursuant to Rule 506(c) of Regulation D as promulgated under the Securities Act (“Private Placement”). In addition, the offering will not be registered under any state securities laws in reliance on exemptions from state registration. Such securities (your ownership interests) are subject to restrictions on transferability and resale and may not be transferred or resold except as permitted under applicable state and federal securities laws pursuant to registration or an available exemption. All Private Placements on the Platform are intended solely for “Accredited Investors,” as that term is defined in Rule 501(a) under the Securities Act.
No Investment AdviceNothing on this Page should be regarded as investment advice (either with respect to a particular security or regarding an overall investment strategy), a recommendation, an offer to sell, or a solicitation of or an offer to buy any security. Advice from a securities professional is strongly advised to understand and assess the risks associated with real estate or private placement investments. For additional information on RM Securities’ involvement in this offering, please carefully review the Sponsor’s Investment Documents, and RM Securities’ Form CRS, Regulation Best Interest Disclosures, and Limited Brokerage Services Agreement.
1031 Exchange RiskInternal Revenue Code Section 1031 (“Section 1031”) contains complex tax concepts and certain tax consequences may vary depending on the individual circumstances of each investor. RM Securities and its affiliates make no representation or warranty of any kind with respect to the tax consequences of your investment or that the IRS will not challenge any such treatment. You should consult with and rely on your own tax advisor about the tax aspects with respect to your particular circumstances.